Stunning High-Resolution Map reveals Secrets Of Peru’s Forests
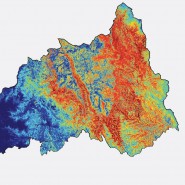
A colorful map of Peru’s landscape has been drawn from research assessing the nation’s aboveground carbon stock. The map portrays carbon density with different colors allowing viewers to see the diversity of Peru’s land in a whole new way and also see the value in preserving its ecosystems.
A colorful map of Peru’s landscape has been drawn from research assessing the nation’s aboveground carbon stock. The map portrays carbon density with different colors allowing viewers to see the diversity of Peru’s land in a whole new way and also see the value in preserving its ecosystems.
This article was originally published on mongabay.com. Click here to read the original.
4 August 2014 | Peru’s landmass has just been mapped like never before, revealing important insights about the country’s forests that could help it unlock the value healthy and productive ecosystems afford humanity.
The research — involving scientists from the Carnegie Institution for Science at Stanford University, Wake Forest University, and Peru’s Ministry of Environment (Minam) — assessed the aboveground carbon stock of all vegetation types across the country using a combination of data from satellites and Carnegie’s advanced laser-based carbon detection system, ground-truthed with data from field studies.
The resulting map is a stunning kaleidoscope of color, ranging from deep red in carbon-dense forests of the Amazon to the cold dark blue of areas devoid of vegetation like heavy gold mining areas and Andean peaks.

The new map reports all of Peru’s ecosystems.
But beyond its visual appeal, the map provides critical information at a one-hectare scale relevant for policymakers and scientists. The study found that vegetation in Peru stores some 6.9 billion metric tons of aboveground biomass, or roughly equivalent to nearly twice the combined annual carbon emissions of the U.S. and China, and documented ecosystem gradients that underpin the country’s rich biodiversity. For example, it found that the lowlands of southern Peru harbor significantly less carbon compared with other rainforest areas due to extensive areas of bamboo. Terra firme forests store more than twice as much carbon as active floodplain forests.

The research tied vegetation data to administrative units and protected areas, including national parks and communal reserves. It found that Loreto contains more than half the country’s total aboveground carbon stock, while Peru’s protected areas store a combined 26 percent of its carbon. That means nearly three-quarter’s of Peru’s carbon is found outside protected areas, underscoring the importance of maintaining those carbon stocks, according to the authors.
“The international community wants to use a combination of carbon sequestration and emissions reductions to combat climate change,” said Carnegie’s Greg Asner, the study’s lead author, in a statement. “Our cost-effective approach allows us to accurately map the carbon in this incredibly diverse country for the first time. It opens Períº’s door to carbon sequestration agreements and is an enormous boon to conservation and monitoring efforts over vast areas for the long term.”

The findings could also help place a value on Peru’s conservation efforts, added co-author Miles Silman of Wake Forest University.
“Now every person in private enterprise and decision makers in regional, local, and national government has an estimate of carbon content for every place in Períº. It should ignite the imaginations of ecologists and earth scientists, and provide a road map for decision makers,” Silman said. “The report also adds another exclamation point to the value of protected areas. If you choose carbon as your currency, parks in Amazonian Períº are the banks, and the bigger the area, the closer it gets to being Fort Knox.”
 The carbon mapping process. The report says the map can be used to measure deforestation and degradation using free Landsat imagery and forest cover monitoring software like as CLASlite, which was also developed by Carnegie. New field plot data can also be added to the map as it becomes available. |
Rhett Butler is the founder, president and head writer for Mongabay.com.
Please see our Reprint Guidelines for details on republishing our articles.