Europe
The European Union Emissions Trading Scheme (EU ETS) remains the largest carbon trading system in the world, covering more than 11,000 power stations and industrial plants in 31 countries. But the program has struggled in recent years amid an oversupply of allowances that has put significant pressure on the price of carbon credits. Launched in 2005, the EU ETS is now in its third phase, running from 2013 to 2020. The program covers about 45% of the EU’s GHG emissions.
COMPLIANCE MARKETS
European Union Emissions Trading System (EU ETS)
The EU ETS became effective January 1, 2005, creating the world’s largest market in greenhouse gas (GHG) emissions to date. The program establishes a mandatory carbon dioxide (CO2) cap-and-trade system, in which sources are allocated a certain number of emission allowances based on historic performance and other parameters.
The ETS was established primarily to help EU member states achieve their Kyoto Protocol targets, as well as provide companies and governments with experience in developing, operating, and participating in carbon markets. The first phase of the EU ETS operated from 2005 to 2007, and the second phase ran from 2008 to 2012.
Participants reducing emissions below their cap can sell the resulting excess allowances. Those companies that find reducing emissions internally to be prohibitively expensive, or those needing to increase production, can buy allowances on the open market.
The cap is reduced over time so that total emissions fall, with the 2013 cap for emissions from power stations and other fixed installations in the 27 EU Member States – before Croatia’s accession on July 1, 2013 – has been provisionally set at just north of two billion allowances, according to the European Commission. For each year after 2013, this cap will decrease by 1.7% of the average total quantity of allowances issued annually in 2008-2012. In 2020, emissions from sectors covered by the EU ETS will be 21% lower than in 2005.
A business regulated under the EU ETS is penalized if it does not surrender enough allowances to cover its emissions. It has to buy allowances to make up the shortfall, is ‘named and shamed’ by having its name published, and must pay a dissuasive fine for each excess tonne of GHG emitted, according to the European Commission. The penalty rises each year in line with the annual rate of inflation in the Eurozone (the group of EU countries using the euro as their currency).
A major revision approved in 2009 to strengthen the system means the third phase is significantly different from phases one and two, namely in that a single, EU-wide cap on emissions applies in place of the previous system of national caps. Furthermore, auctioning rather than free allocation is now the default method for allocating allowances. The number of allowances to be auctioned rises each year, with the rest of the allowances allocated free of charge on the basis of harmonized rules underpinned by benchmarks of emissions performance. Industrial sectors and sub-sectors deemed to be exposed to a significant risk of carbon leakage receive a higher share of free allowances than those that are not.
In January 2012, the aviation sector was brought into the EU ETS, with a cap on aviation allowances that was 3% lower than aviation emissions in the 2004-2006 reference period. Direct emissions from aviation account for about 3% of the EU’s total GHG emissions, a substantial majority of which come from international flights. But the decision sparked fierce opposition from countries such as China and the United States. In December 2011, the European Court of Justice ruled against certain US airlines and their trade association that pursued legal relief against the inclusion of aviation in the EU ETS, with the court finding that the EU’s legislation on aviation emissions is compatible with international law. But in November 2012, the EU decided to institute a one-year delay against penalizing the aviation sector for non-compliance while the International Civil Aviation Organization (ICAO) developed an alternate solution to regulate global airline emissions. In September 2013, the EU agreed to limit the application of its ETS to non-EU flights only to cover emissions occurring in EU airspace rather than the entire flight until 2020 if agreement is reached on an ICAO proposal for a global market-based mechanism covering the sector. However, countries such as China and the United States balked at the compromise, demanding that the EU exempt all emissions from non-EU originating flights into its airspace.
The EU ETS faces a major challenge due to a growing surplus of allowances, largely because of the economic crisis that depressed emissions at a higher level than anticipated. At the start of the third phase, the surplus stood at almost two billion allowances and is expected to exceed 2.6 billion allowances by 2020. European officials gave the final stamp of approval to a plan to shore up the EU ETS by withholding 900 million permits from 2014-2016, a temporary solution known as backloading. However, as this solution increased the potential for market volatility, a more permanent solution in the form of a market stability reserve has been proposed to hold and possibly release these allowances under certain, pre-determined market scenarios, beginning in 2019.
To date, installations regulated under the EU ETS have used nearly 1.5 billion Certified Emission Reductions (CERs) generated under the Kyoto Protocol’s Clean Development Mechanism (CDM) program and Emissions Reduction Units (ERUs) generated under the Joint Implementation (JI) program. This represents 90% of the total offsets allowed by the EU ETS between 2008 and 2020 and 60% of the total Kyoto Protocol offsets issued so far, according to the World Bank’s Carbon Pricing Watch brief.
Switzerland
Switzerland’s Emissions Trading System (ETS) was introduced in 2008 as a voluntary alternative for complying with the country’s CO2 levy on heating, industrial processes, and transport fuels, but as of 2013 transitioned to become a mandatory ETS for certain high-emitting companies, according to Switzerland: An Emissions Trading Case Study. In 2011, revisions to the Swiss ETS brought the program more in line with the EU ETS, with an eye toward a potential linkage – a 7th round of negotiations on linking occurred in March 2015. The Swiss ETS is relatively small in size: 3.4 million tonnes of carbon dioxide (MtCO2e) in 2010 compared to Phase II of the EU ETS, which covers about 2,083 MtCO2e per year, the case study noted.
The Swiss ETS accepts Kyoto Protocol international offsets: CERs from the CDM program, ERUs from the Joint Implementation program and Removal Units. Temporary certificates from carbon sink projects such as afforestation and reforestation are allowed, but they cannot be banked for use in future commitment periods, according to the case study.
Related Links
European Commission on market stability reserve
World Bank’s Carbon Pricing Watch
Switzerland: An Emissions Trading Case Study (IETA)
VOLUNTARY MARKETS
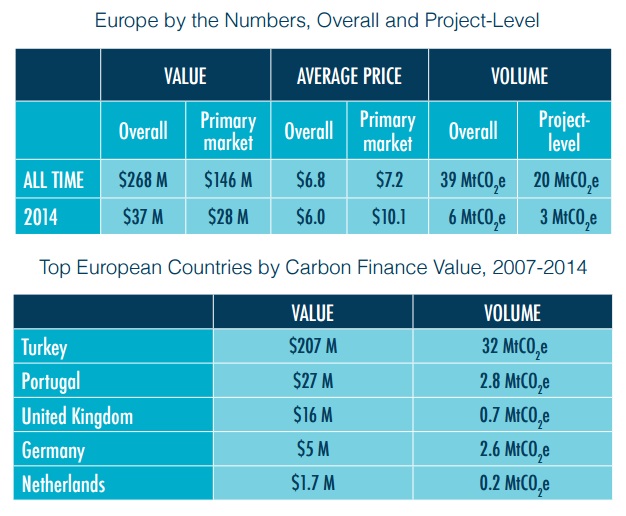
Europe has always acted more as a buyer than supplier in the global voluntary market, as the European Union’s (EU) Kyoto Protocol obligations cover most emissions within those countries. Instead, most voluntary project development in Europe has occurred outside of the EU, primarily through renewable energy projects in Turkey.
The country was listed under the international climate agreements as an “advanced developing country” – meaning that it did not have to reduce emissions like other Annex I countries but could not participate in carbon markets as a Clean Development Mechanism offset supply country either. Instead, the voluntary market offered the only clear pathway to incentivizing low-carbon activities and the country has historically sold the most offsets of any EU member or non-EU member European state. Its cumulative volume, 31.7 million tonnes (MtCO2e), dwarfs those of other European nations, according to Ecosystem Marketplace’s State of the Voluntary Carbon Markets 2015 report. However, while average prices in the past had never dropped below $4 per tonne, the average Turkish offset sold for $2.4 per tonne in 2014.
A number of forestry offset programs have come onto the scene in recent years in Italy, the United Kingdom (UK) and Portugal in markets that nonetheless do not meet “additionality” requirements for going above and beyond. In the UK, forestry projects are created under the Woodland Carbon Code (WCC), a domestic voluntary carbon standard administered by the UK Forestry Commission that allows companies to include WCC offsets in their mandatory emissions reporting. Italian developers, on the other hand, are waiting for the government to clarify the role of forests in the country’s national emissions accounting before finalizing an Italian Forest Code. While European offsets transacted at the highest average price of all regions – $11.2 per tonne – volumes (a total of 2.5 MtCO2e tonnes in 2014) were tiny in the scope of global supply.
Related links
Ahead of the Curve: State of the Voluntary Carbon Markets 2015 report (Ecosystem Marketplace)