Remote Sensing: A Primer
Nearly all types of environmental finance – whether mitigation banking, payments for watershed services, or REDD – involve some form of remote sensing. But this catch-all phrase encompasses scores of practices using radar, lidar, and infrared technology from satellites, airplanes, and blimps. Here’s how they all fit together.
Nearly all types of environmental finance – whether mitigation banking, payments for watershed services, or REDD – involve some form of remote sensing. But this catch-all phrase encompasses scores of practices using radar, lidar, and infrared technology from satellites, airplanes, and blimps. Here’s how they all fit together.
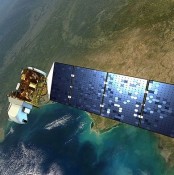
11 February 2013 | The National Aeronautics and Space Administration (NASA) and the US Geological Survey (USGS) today are sending Landsat 8 into space – ensuring the continuation of the world’s longest-lasting satellite-based remote sensing operation.
Such activities are essential to most ecosystem management projects, and the term essentially means the act of collecting information or data without actually touching the object you’re observing. You can do this either actively – by, for example, shining a light on it – or passively – by, for example, looking at it with its own natural light.
In technical terms, active sensing means sending out energy that bounces off an object and comes back to you, while passive sensing means detecting the natural radiation that an object either emits or reflects.
How it Works
Different surfaces reflect light differently, and this means that remotely-sensed data can be categorized by wavelengths of reflected light. Some of these relationships – especially in the visible spectrum – are obvious. Blue wavelengths, for example, depict water-covered areas, while green wavelengths correspond to healthy vegetation.
Many remote-sensing applications combine visible wavelengths with infrared wavelengths, which are less susceptible to atmospheric distortion and are very useful in differentiating vegetation types. Since infrared wavelengths are sensitive to plant and soil moisture content, they can be used to distinguish clouds, snow, ice, and soil boundaries.
Lastly, microwaves are also used in remote sensing since their longer wavelengths can better penetrate cloud cover and low light conditions. Active RADAR remote sensing uses these longer microwaves signals to “see through” a forest canopy to the ground below.
Why We Need It to Measure Forest Emissions
Deforestation generates roughly 15% of all global greenhouse gas emissions, which is why environmental non-profits developed programs that use carbon finance to save endangered forest and reduce greenhouse gas emissions from deforestation and forest degradation (REDD). The programs face significant challenges in implementation and monitoring, largely because of disagreement over which tools are best for measuring forest emissions.
Most emphasis in remote sensing has been on improving data representation of forest area loss; but for project managers and investors to obtain full knowledge of a forest, they also need knowledge of the carbon stored. Remote sensing techniques for monitoring overall forest cover and forest loss are widely accepted, but the technologies and techniques for their use in estimating biomass have yet to be fully approved by regulatory agencies. The work in active sensors (LiDAR and RADAR) are still considered new, but are increasingly proving themselves.
Currently, the region of most uncertainty and of most importance to understanding carbon stocks lies within a forests’ biomass. Above-ground biomass (AGB) accounts for 70-90% of all forest biomass carbon; the specific amount varies based on the climate, geography and other local factors. As the name implies, below-ground biomass contains the remaining carbon; however, this biomass remains difficult to obtain and is usually estimated based on AGB data.
Unfortunately, many large-scale estimates about forest biomass are inaccurate. Country reports to the Food and Agriculture Organization (FAO) often show highly variable biomass estimates -which change over time based on improved information instead of actual, on-the-ground changes in forest carbon. Additionally, countries relying on the Intergovernmental Panel on Climate Change (IPCC) guidelines will almost certainly over- or under- estimate their stock. The IPCC Tier 1 guidelines (the simplest to use) employ broad assumptions, often estimating carbon stocks on continental-scale ecological zones. This misses more nuanced ecological zones and/or different levels of human disturbance. The resulting predictions have high uncertainties and generate low confidence from investors.
Potential investors and monitoring agencies thus face a major technical problem: they need access to high-resolution data, obtained in a cost-effective manner. To complicate things, there is currently no standardized methodology. As a result, researchers have proposed numerous methods using plot-based field studies combined with one or more remote sensing technologies.
All remote sensing studies start with plot-based field studies. Researchers use the results gathered on land to double-check remote sensing results and to formulate equations that can extrapolate on the remote sensing data, a process we explored in Ghana Measures Forests from Sky and Land.
Remote monitoring via satellites can provide high area coverage at a low cost, but the lower resolution data generated needs more field-based plot studies to retain accuracy. Conversely, airborne remote sensing gives resolutions higher than those from satellites and has the advantage of needing less field plots to accurately convert the data. However, planes also have higher operational costs, and this currently limits airborne remote sensing’s feasibility in large scale projects. Lastly, ground-based remote sensing may supplement field-based plots in obtaining below ground biomass data. As of now, this new field has potential use within smaller sample sites but will likely not be applied on a larger scale.
The Common Technologies
Passive remote sensing only uses visible and/or infrared wavelengths. The resulting images reflect what we might see looking out of an airplane; the data only shows the treetops of forests and cannot penetrate into the canopy below (like LiDAR or radar systems). Using this horizontal distribution data, scientists can estimate biomass through common algorithms such as the Normalized Difference Vegetation Index or Leaf Area Index.
While optical remote sensing does not collect as much data as LiDAR or radar remote sensing systems, it remains particularly useful in determining tropical forest biomass. This is because radar and LiDAR begin to lose their precision in more compact environments. Current instruments perform admirably in woody forests or savannahs; however, after crossing a certain density threshold, or saturation limit, they become less reliable. Though saturation limits may range, almost all may be found within dense tropical forests. Researchers can use optical data to estimate biomass through complex algorithms, including regression models and neural networks.
Thus, optical remote sensing remains very much in use for studying forest biomass, especially in tropical forests, even through other remote sensing technologies yield more data. Current optical sensing technologies may be separated by their resolutions.
In particular, very-high resolution imagery (VHRI) provides high resolutions of up to 1 meter in accuracy. Privately owned satellites, from well-known companies like Google and DigitalGlobe, provide this data. While most of these image snapshots may be freely obtained, the data underlying these images remains expensive. If this price drops in the future, VHRI might become more commonly processed in remote sensing studies; but for now, it is rarely used.
Optical data at medium resolutions range from 10-100 m resolutions. The most commonly used are from NASA’s Landsat program, the longest continuous Earth observation project. There have been several successions of Landsat satellites; the most recent was the Landsat 7, launched in 1999. The Landsat 7 remains operational today; however, it began experiencing glitches in its data starting in 2003. With up to 25% of the data unreadable, many researchers still refer to the Landsat 5, which was launched in 1984 and operated problem-free until late 2011. While there has not been continuous, quality Landsat data since late 2011, today’s launch of the new Landsat 8, Data Continuity Mission should help fill that gap.
Today almost all remote sensing projects utilize Landsat data, largely because the data can be easily matched with country vegetation indices to accurately predict biomass. Another reason for its frequent use could be because currently, image textures are more effective in determining biomass in tropical forests with high saturation than spectral data. Regardless of the cause, climate negotiators recognized the Landsat project’s continuity and high spatial and temporal resolution and suggested it as the primary remote sensing methodology for REDD projects at the COP15. Also around this time, the convenience of using Landsat data to evaluate highly dense tropical forest data was made easier by the release of CLASlite, or the Carnegie Landsat Analysis System. This software program allows users to enter Landsat satellite images and then analyzes the data using a combination of calibration, atmospheric correction and other algorithms to heighten any deforestation imagery. The CLASlite software has already been updated to accept the new Landsat 8 data.
Lastly, coarser resolutions of 100 m resolutions or greater include MODIS, MISR, AVHRR, and SPOT; these have been used to estimate biomass with varying accuracy. In general, studies have used optical data from these sources in regional or continental-scale estimates; but they lose accuracy in smaller plot sizes.
In medium and coarse resolutions, it becomes more complicated to verify the accuracy of the data against field plots, as the plots and pixel size usually do not match. Oftentimes, researchers employ additional statistical procedures to combine the data. In an unexpected twist, a drawback of VHRI may be too much detail; the shadows caused by the canopy and topography can complicate AGB estimations. In addition to all of these considerations, researchers must also take into account processing times for the data. Higher quality imaging requires large data storage capabilities and takes a longer time to process.
LiDAR
While LiDAR also uses many of the same wavelengths as optical imaging, it has the added benefit of producing vertical distribution data. This reveals information hidden below the canopy, including canopy height and canopy vertical profile, which can be used to calculate AGB. The data collected depends on the wavelengths emitted by the LiDAR; there are currently three major types in use.
First and Last Pulse systems record wavelengths of up to 100 cm, called small footprint systems. The first pulse reveals the initial contact upon a forest and reveals only height data. The last pulse penetrates through the canopy cover – but may or may not actually reach the ground. Despite this limited data, small footprints often have higher repetition rates and can thus collect high resolution data of the top canopy. Another practical advantage of these systems is that they are widely used and most often available.
As more pulses are recorded between the first and last, the LiDAR system needs more detecting instruments to detect multiple return pulses. This may result in collecting data about a second and third pulse; or in the case of large footprint systems (10-100m), the entire return pulse may be recorded. However, this data density is still not the best method for collecting vertical data.
Waveform instruments record the signals from the laser at fixed time intervals. Waveform LiDAR has been created primarily for measuring vegetation, and can record: canopy height, crown size, vertical distribution of the canopy, biomass and leaf area index; and provides more accurate data than other LiDAR applications. Only a few airborne instruments, such as LVIS, and the satellite GLAS use waveform sensing. Most airborne LiDAR instruments do not employ waveform data collection because the large amounts of resulting data and the difficulties with interpreting it. As researchers Ashar Vazirabad and Mahmut Karslioglu noted noted, “From the data acquisition point of view, it is obvious that models and methods need to exploit the whole potential of the full waveform data for biomass estimation in future.”
Instrument Types
Currently, almost all LiDAR research utilizes airborne remote sensing. Airborne LiDAR began in the 1990’s when researchers discovered that combining GPS positioning with a laser resulted in very accurate measurements of topography and other data. Since then, airborne LiDAR has grown tremendously, and companies all over the world offer airborne LiDAR at ever-decreasing costs. A recent study using the Carnegie Airborne Observatory to operate the LiDAR, process the data, and provide maps paid less than $.08/ha. Despite these low prices, airborne LiDAR in remains cost-effective only within smaller projects and not those found at a national scale.
So far, only one LiDAR satellite has been launched, NASA’s ICESat GLAS . NASA launched the ICESat, the Ice, Cloud, and land Elevation Satellite in 2003 and decommissioned it in 2010. A part of ICESat, the Geoscience Laser Altimeter System GLAS used three lasers to emit infrared and visible laser pulses. While GLAS collected topographic data, the lasers were not able to penetrate substantial cloud cover and thus did not provide uninterrupted data of the ground. Other complications include the 70 m wide resolutions, which make it impractical to use as primary data. However, this unequal spatial data from GLAS may be supplemented with optical imagery data to obtain accurate biomass values and the wide resolutions come in use for larger studies. One such study determined that GLAS data was more accurate at regional levels – making it ideal for larger studies and not small projects. Despite the nearly global coverage and low cost, not many studies employ GLAS.
Terrestrial LiDAR applications are also rare but gaining more use. However, they do not provide equivalent data to satellite or airborne data. Researchers primarily use them as a supplement in determining beneath canopy data. And like all other remote sensing applications, field plots are needed to convert any LiDAR metrics to AGB data.
RADAR
Unlike LiDAR and optical data, Synthetic Aperture Radar (SAR) emits radio waves and combines the resulting backscatter data into a single image. While there is a strong relationship between backscatter data and above ground biomass, this relationship crumbles after reaching the saturation limit.
Backscatter depends on the size and reflectivity of the object when returning to the emitting device; larger and more reflective objects show up more clearly. The wavelength and polarization are two important considerations for affecting the backscatter in SAR. The most commonly used wavelength for forest biomass studies is the L-band; which uses a longer wavelength between 15-30 cm. With smaller wavelengths (such as the 3 cm X-band), the backscatter picks up smaller components of a tree, including leaves and small branches, and does not penetrate as deeply into the foliage. Short wavelengths are more sensitive to seasonal and site changes. Longer wavelengths only reflect from larger branches, stems, and terrain; giving a more accurate vertical profile of a forest.
L-band wavelengths usually have maximum AGB values around 100-150 Mg ha-1; thus, they are accurate in mixed tree and grass systems such as savannahs and woodlands, but lose their predictive value in many densely forested regions. P-band data has not been used in satellites, but has been used in NASA’s airborne AIRSAR system. Research showed that these longer wavelengths only begin to become saturated at 200 Mg ha-1 ; and might retain predictive qualities up to 300 Mg ha-1.
There are four types of polarization wavelengths used in SAR: HH, HV, VV, and VH. Most remote sensing methodologies use HV and HH data. HH data stands for horizontal-send, horizontal-receive data. These wavelengths pick up a wide range of objects, including trees, buildings, and ground cover. Due to its high sensitivity to reflection, HH wavelengths are more sensitive to changes in moisture. When the ground is wet or flooded, HH wavelengths have a tendency to double bounce, reflecting off both a tree and the ground. This can lead to variation in HH data between dry and wet seasons. Conversely, HV data responds less to changes in moisture due to its nature as horizontal-send, vertical receive data. This means the data is cross-polarized; that is, HV pulses emit horizontally but are received vertically. Instead of reflecting straight off an object, HV wavelengths are only received if they reflect off an object at a 90 degree angle. Complex structures like trees can easily reflect HV wavelengths; whereas soil will result in a backscatter. This makes HV data more sensitive to biomass than HH data; and researchers increasingly favor it in current studies.
VV and VH data are rarely utilized; VV data is less responsive than HH data while VH data is virtually the same as HV data. However, some experimental studies have tried combining HH, HV, VH, and VV data (called “fully polarimetric data”) to recreate the distribution and size of the scattering. While this methodology has a lot of potential, it remains largely untested at this point.
Instrument Types
While airborne systems exist and can provide resolutions up to 10 cm, most researchers use satellite data, which can be obtained cheaply or freely:
ALOS PALSAR was launched in 2006 by JAXA, and remained operational until 2011. The satellite updated its data every 46 days, and obtained resolutions of 10 m to 100 m. This depended on whether the high resolution or SCANsar mode was used. The satellite used long-wavelength (L-band, 23 cm wavelength), which has the capacity to collect both HV and HH data. Overall, it provided higher performance than JER-1due to its dual high resolution and use of ScanSAR. The data is available at no cost to the scientific community through the Alaska Research Facility.
Japanese Earth Resource Satellite (JERS-1) was launched in 1992 by the Japanese Aerospace Exploration Agency (JAXA) and remained functional until 1998. The satellite had a 44 day repeat orbit that allowed image coverage of most of the Earth. The satellite used an L-band wavelength, operating with HH polarization and obtained resolutions of 18 m with a swath width of 75 m. Due to the different scan wavelengths, it is only possible to combine ALOS PALSAR and JERS-1 images with advanced calculations.
Future Projects:
An ideal large-scale AGB measurement system would be able to collect AGB data independently of cloud cover and contain no upper biomass limit. Currently, no such system exists; but future satellite platforms will come much closer to meeting these goals:
ICESat-2is slated to launch in 2016. The mission objectives are similar to the original ICESat: it is primarily concerned with measuring sea levels and changes in ice sheets; however, the ICESat will also measure vegetation canopy height to estimate biomass and biomass change. Unlike the ICESat, ICESat-2 will emit micro-pulses and multiple beams, which should improve elevation estimates for rough areas and steep slopes.
ALOS-2 is supposed to launch in 2013 by JAXA. It will provide more data than ALOS, with its faster repeat cycle of only 14 days.
Furthermore, while it will continue to provide ScanSAR data at 100 m resolutions and PALSAR data at 10 m resolutions, it will also have a spotlight mode (with 1-3 m resolution) and a high resolution mode (with 3-10 m resolutions).
BIOMASS’s primary objective is to measure the global distribution of forest biomass. It will employ a P-band SAR, which the ESA claims will allow for “biomass at a resolution and accuracy compatible with the needs of global reporting on carbon stocks and terrestrial carbon models.” BIOMASS will provide 100 m resolution.
DESDnyl is supposed to be launched by NASA in 2021. It will use a L-band SAR system capable of 10 m resolution, and have a 12-16 day repeat cycle. The radar will also use a new imaging technique, “SweepSAR,” that will use full polarization and image swaths of up to 240 km.
Additional resources
Please see our Reprint Guidelines for details on republishing our articles.